Signal Versus Ceremony: Rethinking What Cloud Observability Is Actually Supposed to Do

Photo by Photo by Growtika on Unsplash on Unsplash
Ask most platform engineering teams whether they have observability, and the answer will almost certainly be yes. Ask them how long it took to diagnose the last significant production incident, and the answer will frequently reveal a different story — one involving hours of log trawling, inconclusive traces, and a post-mortem that ultimately attributed the root cause to something the monitoring infrastructure never surfaced clearly.
This gap between the appearance of observability and its operational utility has become one of the more consequential problems in cloud operations. Organizations invest significantly in logging pipelines, distributed tracing frameworks, and metrics dashboards, then discover during a live incident that the data they have collected does not answer the questions they are actually asking. The infrastructure looks comprehensive. The alerts fire reliably. And yet the team is still guessing.
The Architecture of False Confidence
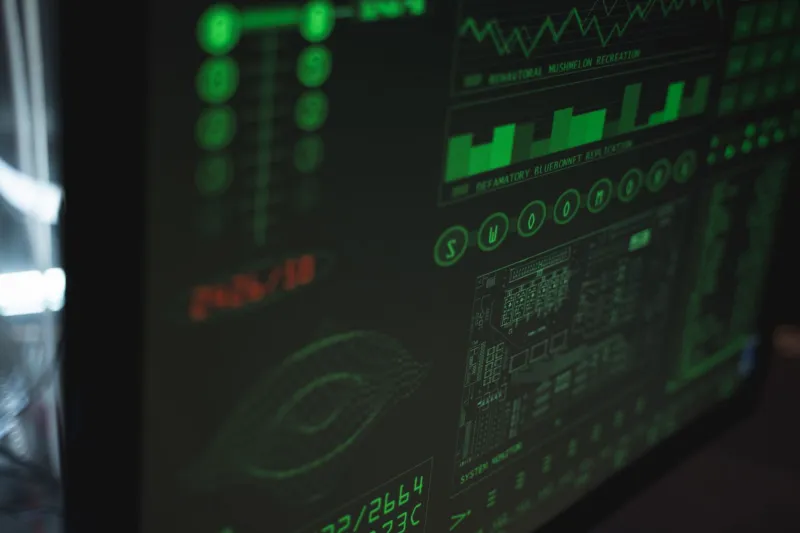
Performative observability — a term gaining traction among site reliability engineers who have lived through enough post-mortems — describes a state in which the signals being collected are technically accurate but operationally uninformative. The logs are real. The metrics are real. The dashboards are populated and colorful and update in near-real time. But the system being observed is complex enough that the data being captured reflects its surface behavior rather than its internal state.
This is not a tooling failure in the conventional sense. The problem is not that the logging framework is broken or that the tracing library is misconfigured. The problem is that the observability posture was designed to demonstrate coverage rather than to support decision-making. Teams instrument what is easy to instrument. They build dashboards that reflect the metrics available rather than the questions worth answering. They set alert thresholds based on historical norms rather than on what threshold violations actually indicate about system health.
The result is a monitoring environment that generates substantial volume — millions of log events per day, hundreds of active alerts — while providing minimal clarity during the moments it is most needed.
Why High Log Volume Is Not the Same as High Observability
There is a widespread assumption in engineering culture that more data is inherently better, and that gaps in observability can be addressed by instrumenting more components, retaining logs for longer periods, and increasing metric resolution. This assumption is not merely wrong — it is actively counterproductive.
High-cardinality log data without meaningful structure becomes noise at production scale. When every service emits verbose logs for every request, the signal-to-noise ratio degrades to the point where finding a relevant event during an incident requires the kind of institutional knowledge that cannot be documented, cannot be transferred, and disappears entirely when the engineer who built the system leaves the organization.
Distributed tracing faces a related problem. Trace data is only as useful as the sampling strategy and context propagation that underlies it. Teams that instrument services independently, without a coherent approach to trace correlation, end up with traces that are internally consistent but impossible to connect across service boundaries. The trace exists. It is just not the trace that would have told you anything useful about why the request failed.
What Distinguishes Actionable Observability
The organizations that have moved beyond observability theater share a common reorientation: they begin with failure modes rather than with instrumentation coverage. Instead of asking "what can we log," they ask "what are the specific ways this system can fail, and what would we need to know to detect and diagnose each one?"
This failure-mode-first approach produces a dramatically different instrumentation strategy. Rather than capturing everything and hoping the relevant signal surfaces when needed, it identifies the handful of indicators that carry genuine diagnostic weight — the metrics that change in predictable ways before user-visible degradation occurs, the log events that distinguish between error classes that require different responses, the traces that reveal which service boundary is responsible for latency accumulation.
In practical terms, this often means instrumenting less but more deliberately. A well-structured structured log entry that captures request context, upstream dependencies, and error classification is more useful than a thousand lines of verbose debug output. A single latency histogram broken down by service dependency tells you more than a global error rate that aggregates across failure modes that have nothing to do with each other.
The Alert Fatigue Spiral and How It Compounds the Problem
Alert fatigue is a well-documented phenomenon in security operations, but it applies with equal force to cloud infrastructure monitoring. When alerting thresholds are calibrated too broadly — or when the same underlying condition triggers alerts across multiple redundant monitoring systems — on-call engineers learn to treat alerts as background noise rather than actionable signals.
This behavioral adaptation is entirely rational given the environment, and entirely dangerous given the stakes. The engineer who has responded to 200 alerts in the past month that resolved without intervention will respond more slowly, and with less urgency, to the alert that actually represents a cascading failure. The monitoring system has trained its users to disregard it.
Remediation requires not just reducing alert volume but restructuring alert logic around response actions. An alert that an engineer cannot act on within a defined window — either because it lacks context, because the appropriate response is unclear, or because the condition it describes is not actually actionable — should not be an alert. It should be a metric that feeds into a dashboard reviewed during business hours, or it should not be collected at all.
Building an Observability Practice That Survives an Incident
The test of an observability system is not how it looks on a Tuesday afternoon when everything is working. It is how useful it is at 2 a.m. on a Saturday when something is wrong and the engineer on call has never seen this particular failure mode before.
That test demands observability infrastructure that is self-explanatory — where the data available in the monitoring environment is sufficient to reconstruct what happened without requiring tribal knowledge of system internals. It demands correlation between signals, so that a spike in one metric can be connected to events in adjacent services without manual investigation. And it demands that the people building the observability infrastructure think of it as a product with users — the engineers who will rely on it under pressure — rather than as a compliance exercise that satisfies an architectural checklist.
The organizations that have closed the gap between observability theater and operational clarity did not do so by purchasing better tools. They did so by asking harder questions about what they were actually trying to know, and then building the instrumentation that would answer those questions specifically. That discipline — the willingness to do less, more deliberately — is what separates monitoring that reassures from monitoring that works.